Top 10 DC Fast Charging Station Suppliers Worldwide
Choosing a DC Fast Charging Station supplier involves more than comparing headline charging speeds. Buyers must consider power output, connector options, network software, warranty terms, and service coverage. A charger rated at 300 kW may not deliver that power continuously under every site condition. Grid capacity, vehicle compatibility, and cable handling all affect daily performance. Small details matter.
This overview of the Top 10 DC Fast Charging Station Suppliers Worldwide introduces companies active in a fast-changing market. It offers a practical starting point, not a universal ranking. Supplier capabilities can differ by region, product line, and project size. A useful comparison looks at published specifications alongside installation support, uptime tools, spare-parts access, and documented deployments. Ask for evidence. Check which models are currently available in your market, and confirm that quoted performance applies to your intended setup. Some project requirements are easy to overlook until equipment reaches the site. That is not always a supplier’s fault; planning assumptions can be incomplete too. The following guide highlights what each supplier offers and where further verification may be needed. Its aim is to help fleet operators, charging-network teams, and site developers ask sharper questions before choosing equipment.
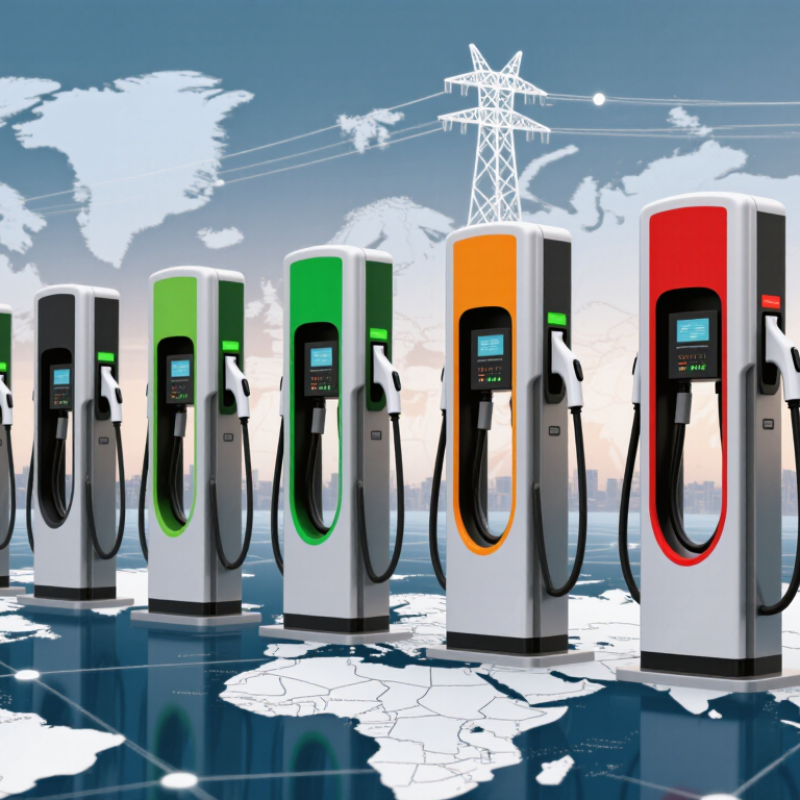
DC Fast Charging Defined: Power Classes, Connectors, and Charging Standards
DC fast charging converts grid power to direct current inside the station, then feeds the vehicle battery. This bypasses the car’s onboard AC charger. Power classes are useful shorthand, not one universal classification: equipment is commonly grouped around 50–150 kW, 150–350 kW, and above 350 kW. Actual charging speed also depends on battery temperature, state of charge, and vehicle limits. A 350 kW unit cannot make every car charge at 350 kW.
Connectors and communication rules matter as much as rated power. Common DC interfaces include CCS Combo 1, CCS Combo 2, CHAdeMO, and GB/T; availability varies by market and vehicle. IEC 62196 covers plugs and vehicle inlets, while IEC 61851 addresses conductive charging systems. The IEA’s Global EV Outlook 2024 reports that public fast-charger stock grew by 55% in 2023, with China accounting for about 85% of the global total. That growth makes interoperability more than a technical footnote. Check the connector, voltage range, and communication compatibility before specifying equipment. Details can be messy. Even clear labels may hide different real-world charging performance.
Global Market Snapshot: More Than 550,000 Public Fast Chargers in 2023 (IEA)
The headline figure is striking: more than 550,000 public fast chargers were operating worldwide in 2023. The International Energy Agency’s Global EV Outlook 2024 reports that this network grew by about 55% in one year. A fast charger can turn a short stop into useful added range, especially on highways and during busy travel periods. Still, the global total does not tell drivers how many chargers are near them, available, or working.
Deployment is uneven. The IEA reports that China held roughly 70% of the world’s public fast chargers in 2023, while many other markets had much thinner coverage. That matters at a practical level: a charger beside a major road is less helpful if queues form or nearby routes lack alternatives. The IEA also notes that public charging must expand alongside electric vehicle sales, with local grid capacity and site access shaping where equipment can be installed. Growth is real. Access varies.
For buyers comparing suppliers, the market snapshot is a starting point, not a service-quality score. Charger counts alone do not reveal uptime, charging performance, payment options, or maintenance response. Public datasets can also differ in how they classify and update charging locations. That uncertainty deserves attention. A stronger comparison pairs deployment figures with verified operating data and feedback from drivers using stations in the field.
Top 10 DC Fast Charging Station Suppliers Worldwide - Global Market Snapshot: More Than 550,000 Public Fast Chargers in 2023 (IEA)
Supplier-neutral overview of the global charging market. Figures describe charging infrastructure and electric-vehicle adoption; they are not supplier rankings.
| No. | Market Dimension | 2023 Figure | Market Context |
| 1 | Public charging points worldwide | More than 4 million | Includes publicly accessible charging points across charging speeds. |
| 2 | Public fast chargers worldwide | More than 550,000 | The global public fast-charging network continued to expand in 2023. |
| 3 | Fast chargers added worldwide in 2023 | Approximately 330,000 | New installations accounted for a substantial share of the year’s network growth. |
| 4 | Year-on-year growth in public fast chargers | About 55% | Fast-charger stock grew faster than the public charging network overall. |
| 5 | IEA fast-charger category | Above 22 kW | Power rating used to distinguish fast chargers from lower-powered public chargers in IEA reporting. |
| 6 | Ultra-fast charging category | Above 150 kW | Higher-power charging can support shorter charging stops, subject to vehicle capability and site conditions. |
| 7 | China’s share of global public fast chargers | Approximately 85% | China had the largest concentration of public fast-charging points in 2023. |
| 8 | China’s share of global public charging points | Approximately 70% | China also represented the majority of the worldwide public charging-point stock. |
| 9 | Electric cars in use worldwide | Nearly 40 million | A growing electric-car fleet is increasing demand for accessible charging infrastructure. |
| 10 | Electric-car sales worldwide | Nearly 14 million | Electric cars represented about 18% of new car sales globally in 2023. |
Source: International Energy Agency (IEA), Global EV Outlook 2024. Figures are rounded; charger counts refer to charging points, not necessarily individual sites or stations.
Supplier Comparison Criteria: Power Output, Reliability, and Global Service Coverage
A useful comparison of DC fast-charging suppliers starts with power output, but the rated figure is only part of the story. Check whether a station can deliver its advertised power across several charging sessions, including during hot afternoons or busy periods. A unit rated at 300 kW may share power between connectors, so ask how output changes when two vehicles plug in. Numbers need context.
Reliability shows up in maintenance records and practical service details. Request uptime figures, fault-response times, and information on replacement parts. Ask how remote monitoring identifies a failed connector or cooling-system warning. Downtime is expensive. A supplier’s service plan should explain who responds, how quickly, and whether local technicians can handle common repairs. Look for evidence from operating sites, not just a polished specification sheet.
Global coverage matters when equipment will serve multiple regions. Confirm that support teams, spare parts, and language assistance are available where each station will operate. Also compare warranty terms and software-update procedures; unclear responsibilities can slow a repair. No scorecard is perfect. I would give verified field performance more weight than a long feature list, while admitting that reported uptime can be measured differently across suppliers. A site visit or reference call may reveal details a proposal leaves out.
Top 10 DC Fast Charging Station Suppliers Worldwide
Supplier Comparison Criteria: Power Output, Reliability, and Global Service Coverage
The chart shows representative DC fast-charger rated power classes available in the market; it does not rank or identify suppliers. Compare reliability using consistently defined uptime data, and assess service coverage by region, since these measures are not directly comparable across suppliers without a shared methodology.
Top 10 Worldwide Suppliers: Product Portfolios and Regional Strengths
Across the ten leading global suppliers, portfolios increasingly combine modular power cabinets, separate charging dispensers, and software for remote monitoring. Common outputs range from around 60 kW for compact sites to 350 kW or more for high-throughput corridors. Some suppliers emphasize liquid-cooled cables and shared power allocation; others prioritize simpler units for urban parking lots. The details matter: a truck stop needs different cable reach and stall spacing from a city curb.
Regional strengths reflect both manufacturing and infrastructure needs. East Asian suppliers often benefit from large-scale production and dense domestic deployment. European suppliers commonly focus on interoperable systems and integration with energy management. North American portfolios often address long-distance routes, weather exposure, and field-service coverage. These are broad tendencies, not guarantees. The International Energy Agency’s Global EV Outlook 2024 reports that public charging points grew about 40% in 2023, while fast chargers grew 55%. China held roughly 85% of the world’s fast chargers, showing how concentrated deployment remains.
A supplier’s rated power alone is a poor buying guide. Site operators should compare uptime commitments, replacement-part access, software compatibility, and performance under simultaneous vehicle charging. The map is uneven. The IEA figures describe installed infrastructure, not charger reliability, and that distinction is easy to overlook. A technically strong unit can still disappoint if local service teams are thin or grid capacity is limited.
Choosing a Supplier: Site Demand, Grid Capacity, and Charging Network Growth
Choosing a DC fast charging supplier starts with the site’s real demand, not its maximum theoretical capacity. Count vehicles during busy periods, note how long they stay, and check whether queues form around 5 p.m. A highway stop with brief visits needs a different layout from an urban depot where vehicles return together. Small details matter.
Ask suppliers how their equipment shares power across dispensers when several vehicles charge at once. Modular systems and load management can help match available grid capacity, but confirm the limits with a qualified electrical engineer and the local utility. Review transformer capacity, service upgrades, cable routes, and space for switchgear before comparing prices. An attractive unit is not useful if the site cannot supply it.
Look closely at commissioning support, uptime reporting, spare-parts access, and software compatibility with your chosen payment and network systems. Request clear service-response targets and references from sites with similar traffic patterns. Growth is rarely smooth. A site may add chargers in phases, so check whether the supplier can expand power capacity without replacing the whole installation. Forecasts are imperfect; traffic can shift, and utilization may disappoint. Leave room in the electrical design where practical, then revisit demand data after opening.