What Is the Best Off Grid Solar System in 2026?
Choosing the best Off-Grid Solar System in 2026 is less about finding the biggest panel or newest battery. It is about matching equipment to the way you actually use power. A cabin with a refrigerator, water pump, and laptop has different needs from a full-time home with electric cooking. Small details matter. A pump starting at night can place a sharp demand on an inverter, while several cloudy days can expose an undersized battery bank.
Energy-efficiency expert Amory Lovins captured a useful principle: “The cheapest energy is the energy you don’t use.” That idea matters off grid. Reducing standby loads, choosing efficient appliances, and tracking daily consumption can lower system costs and improve resilience. But efficiency is not a substitute for sound design. Panel output, battery capacity, inverter surge rating, seasonal sunlight, and backup options all deserve careful review.
This guide compares system types and components, then explains what to check before buying. Look for clear specifications, realistic performance assumptions, reliable warranties, and support from qualified installers. A neat specification sheet is not proof that a system will fit your site. Nor can any forecast remove every uncertainty: weather changes, batteries age, and household habits shift. The best choice is the one that meets measured needs with sensible headroom—not simply the one with the most impressive numbers.
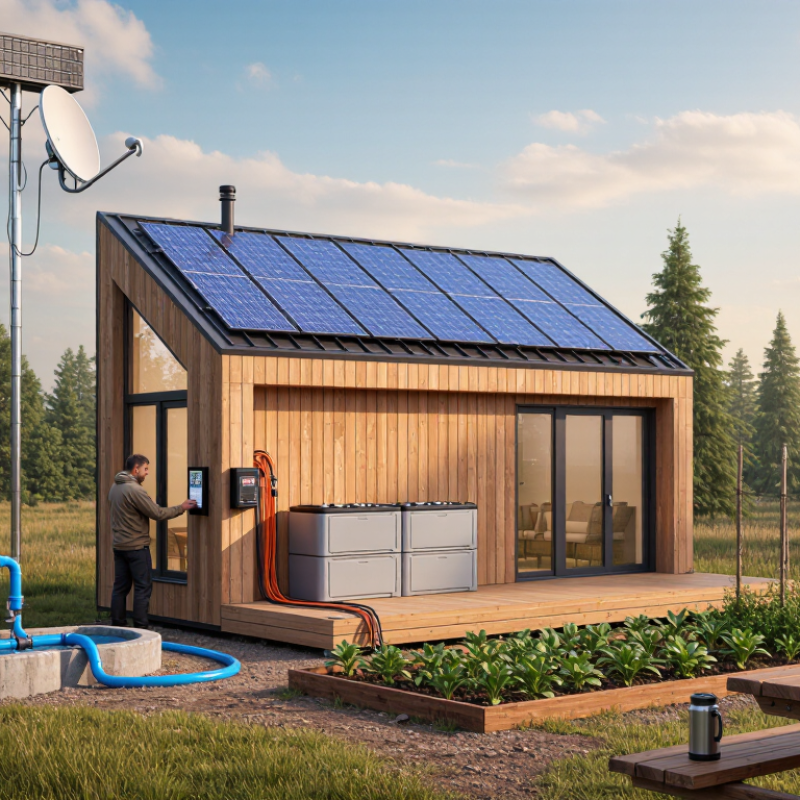
Define Off-Grid Loads by Daily kWh, Peak Demand, and Days of Autonomy
What Is the Best Off Grid Solar System in 2026?
Define the system by three numbers: daily energy, peak power, and autonomy. List each load and its wattage, hours of use, and daily watt-hours. Add them, then divide by 1,000 for daily kWh. The U.S. Energy Information Administration reports average residential electricity use of about 10,791 kWh in 2022, or roughly 29.6 kWh per day. That is a reference point, not a target: a cabin with efficient appliances may need far less. Small loads add up. A refrigerator, water pump, and evening lights can create a higher peak than their daily total suggests.
Peak demand is the combined wattage of appliances running together, including motor-start surges. Check both the inverter’s continuous rating and its surge rating against that moment. For autonomy, multiply daily kWh by the number of days without meaningful solar input. Then account for usable battery capacity, inverter losses, and reserve; battery nameplate capacity is not all available energy. NREL’s PVWatts tool estimates solar production by location and system orientation, helping test whether winter output can replenish the battery. And estimates drift. Recheck them against actual seasonal use.
Tips: Track loads for a week, especially pump and refrigerator cycles. Try a two-day autonomy estimate, then compare it with a cloudy-week scenario. If the numbers feel tight, reduce simultaneous loads or increase storage; don’t size from sunny-day averages alone.
Size PV Arrays for 3–6 Peak Sun Hours and 75–85% System Derating
What Is the Best Off Grid Solar System in 2026?
Size the array from daily energy use, not panel count. Divide daily kilowatt-hours by peak sun hours and a realistic system-performance factor. For a 5 kWh daily load, four peak sun hours, and an 80% factor, the starting array size is about 1.56 kW. At three sun hours, the same load needs about 2.08 kW. That difference matters during short winter days. NREL’s National Solar Radiation Database provides location-specific solar-resource data; use it to check seasonal conditions rather than relying on a national average.
Treat 75–85% as a planning range, not a universal rating. Panel temperature, dust, shading, wiring, charge-controller conversion, and battery charging all reduce delivered energy. NREL’s PVWatts documentation uses a 14% default loss assumption for its standard estimates, but that model is not a complete off-grid battery calculation. Leave more margin where batteries, long cable runs, or cold-weather loads are involved. Small details count: a dusty panel or a shaded corner can quietly cut production.
Then test the system against the weakest solar month, not an ideal summer afternoon. A 2 kW array at three peak sun hours and 75% performance yields roughly 4.5 kWh per day before unusual losses. That may not cover a 5 kWh load. I still see people size for average sunshine; it is an easy mistake. Pair the array estimate with battery capacity and a backup plan, and revisit the numbers after measuring real household use.
Compare Batteries by Usable kWh, 80–100% DoD, and Cycle Life
When comparing off-grid solar batteries in 2026, look beyond the headline capacity. Usable kilowatt-hours show how much energy you can reasonably draw, while nominal capacity describes the battery’s rated storage. For example, a 10 kWh battery operated at 90% depth of discharge offers about 9 kWh before system limits and conversion losses. Actual delivered energy may be lower. Check whether the published figure includes a reserve that protects the battery from deep discharge. Numbers can mislead.
Depth of discharge (DoD) and cycle life belong together. A battery rated for 80% DoD may retain more reserve, while a 100% DoD rating can make more capacity available per cycle. But neither figure alone predicts service life. Compare cycle-life claims at the stated DoD, temperature, and end-of-life capacity; test conditions differ. A quoted 6,000 cycles is not a guarantee of 6,000 full years of daily use. It describes cycles under specified conditions.
I find this comparison slightly awkward, because households rarely discharge batteries in identical patterns. Winter heating, cloudy stretches, and evening cooking all change daily demand.
Match usable kWh to your actual loads, and leave room for inverter losses and a sensible reserve. Check the warranty’s capacity-retention terms, too.
Match Inverters to Continuous Loads and Motor-Starting Surge
An off-grid inverter should match both the power your equipment uses continuously and the brief surge it needs to start. Begin with appliance nameplates, then list what may run at the same time. A refrigerator, well pump, and lights can create a very different load from each device tested alone.
Motor startup matters. A pump may briefly draw several times its running power, but the exact surge depends on its motor and operating conditions. Check the appliance documentation for starting current, and compare it with the inverter’s surge rating and surge duration. Don’t size from wattage alone. A rating that lasts only a moment may not cover a motor that starts slowly or under pressure.
Leave room for real-world overlap. A pump can start while a refrigerator compressor is already running. Check the inverter’s continuous rating, surge capacity, and battery-side current requirements together. The battery and cables must supply the extra current without excessive voltage drop. Small details count. If startup figures are missing, ask the equipment supplier or have an electrician measure the load. Estimates are useful, but they can be wrong; I’d rather revisit an uncertain load than assume every motor starts gently.
Rank 2026 Systems by Energy Yield, Storage, Backup, and Lifecycle Cost
In 2026, the strongest off-grid solar system is not simply the one with the most panels. Rank candidates by annual energy yield, usable storage, backup duration, and lifetime cost. NREL’s PVWatts model estimates solar production using location, array angle, and system losses. That makes local weather and roof orientation essential; a high-wattage array can still underperform in winter shade. Real roofs vary.
Storage should cover actual nighttime loads, not an optimistic daily average. NREL’s 2024 Annual Technology Baseline uses about 85% round-trip efficiency for utility-scale battery storage. Though that benchmark is not a residential guarantee, it highlights why stored energy is never fully recoverable. Compare usable capacity, inverter output, and replacement assumptions. A battery may run lights and refrigeration, yet struggle with a well pump or electric cooking during a cloudy stretch.
For backup, calculate how many hours essential appliances can run without solar input. Then compare lifecycle cost per delivered kilowatt-hour, including installation, maintenance, battery replacement, and lost capacity over time. The lowest purchase price may age poorly. The least certain part of any ranking is future weather and battery degradation; published models cannot predict every household’s habits. A sensible system leaves a modest energy margin, but oversizing everything can waste money.