
English


Choosing a seawater membrane is not a simple matter of comparing salt rejection percentages. A strong Seawater Desalination Membrane must perform under real operating pressure, changing water temperatures, and uneven feedwater quality. Global buyers also need to examine energy demand, boron removal, fouling resistance, cleaning tolerance, and replacement support. The details matter.
This guide reviews ten leading options through practical purchasing criteria. It considers published manufacturer data, independent pilot experience, and performance patterns reported by desalination professionals. Where available, the comparison looks at permeate flow, salt rejection, pressure requirements, membrane area, and expected service conditions. A laboratory result may look excellent, yet full-scale seawater can contain algae, suspended solids, and organic matter that change performance quickly. Performance varies.
Reliable selection also depends on pretreatment, pressure vessels, recovery targets, and local technical support. A membrane cannot solve poor intake design or irregular cleaning procedures. No membrane is perfect. Some models prioritize high productivity, while others offer better stability during difficult feedwater conditions. Buyers should verify claims through pilot testing, current technical datasheets, and applicable industry test methods before approving a large order. This approach supports clearer budgeting and reduces the risk of costly early replacement. It also recognizes an uncomfortable point: rankings can shift when electricity prices, water chemistry, climate, and maintenance skills change. That uncertainty deserves attention, not polished marketing language.
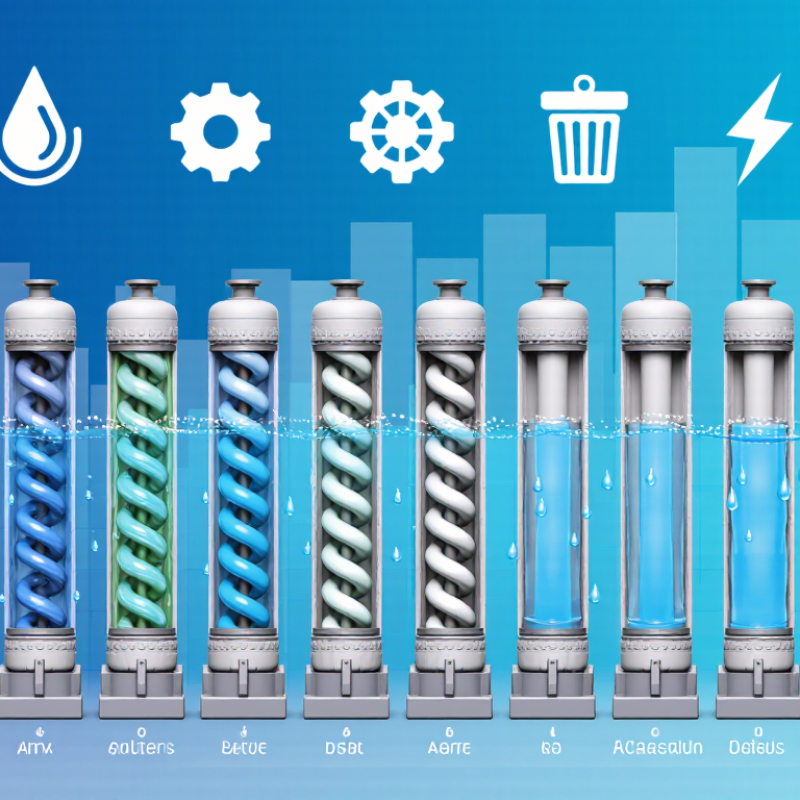
Seawater desalination membranes are thin, selective barriers used in reverse osmosis systems. They allow water molecules to pass under pressure. Dissolved salts, microorganisms, and many contaminants remain in the concentrated stream. Most modern systems use polyamide-based thin-film membranes, arranged inside pressure vessels. Feed pumps commonly apply 55–70 bar to overcome seawater’s osmotic pressure.
Performance depends on salt rejection, water permeability, fouling resistance, and operating life. A typical membrane can reject more than 99% of dissolved salts. However, it does not remove every substance equally. Boron, small neutral molecules, and some organic compounds may require additional treatment. The International Desalination Association reported global desalination capacity above 100 million cubic meters daily in its 2022–2023 Water Security Handbook. Scale is expanding, but energy remains significant. The International Energy Agency places modern seawater reverse osmosis near 3–4 kWh per cubic meter under favorable conditions.
In practice, the clean diagram is misleading. Sand, algae, oil, and suspended solids can quickly damage performance. Pretreatment matters. A pilot test often reveals weaknesses that laboratory data hides. Membranes also age, and replacement intervals vary with feedwater quality.
Tips: Compare normalized permeate flow, salt rejection, cleaning tolerance, and warranty conditions. Check data at your actual temperature and salinity. Laboratory claims are useful, but field evidence is stronger. WHO’s 2022 drinking-water guidance also supports remineralization and careful post-treatment before distribution.
QUICK LINKS
CONTACT US
Office: (+86) 755 23040566
Tel: (+86) 158 9965 5195
E-mail: sale@pcbledmodule.com
Skype: Hans@Rocket-PCB
Whatsapp: 86 1589965 5195
Office Address: 2207,Bid 4,He Gu Shan Hui Cheng,35#,Guang Tian RoYanluo street, Song Gang Town,518105 SHENZHENG, CHINA
Plant ADD.: No 69, Lianfeng North Road, Xianxi Area, ChangAn Town, Dongguan, China.


Copyright © 2025 Rocket PCB Solution Ltd. | All Rights Reserved Sitemap Friendship link: CNC machining heat sink